
To be able to do user-centered design, you would need to be in tight contact with users.
Who are your users?
Who are users? They are people of course, and they are part of your intended or actual target group. They might not be using your product now, but they are the ones that would use it in the future. We talk about actual users to distinguish them from people who might not actually be your users but you might think they are. These are your colleagues, your friends and your relatives. By knowing you (or working in the same domain), they have been biased. Your mother is not a typical mother, she has been influenced by you. These people are often more prone to be early adopters of products similar to yours, since they know you. The actual users might be their friends though, so you can still ask them to introduce you.
The following has to be said: An actual user for a healthcare software aimed at nurses is of course a nurse.
People who has interacted with the actual users can be used in a user-centered design process as well, these are called surrogate users. You need to be aware that these users can never actually substitute a user, but they can be of some help when the actual users are not available.
Where can you find them?
If you work with consumer products, finding actual users often require recruiting them from the general population. This is most easily done using a recruitment firm or a market research firm. Customer support might be a good source as well, if you have an existing product, but to only get people through that tend to give a group of grumpy actual users.
If you work with enterprise products, you can of course use customer support, but the sales department is most likely your best source. Make sure that the people you get are representative of the whole target group.
How do you pick them?
So, you have a steady flow of users set up, but who will you talk to if you do not have time or energy to talk to absolutely everyone, and how do you know you cover the whole target group?
One technique is to base your selection of users on a user cube1 or user graph. You define 2 or 3 (more gets very complex) characteristics of users that you think is important in relation to using the product. These could be experience in the domain, experience of IT tools, experience of the product (or similar products), behavior (such as used to buying things online or the like), context, age, gender, cultural background, etc. From my experience, the three latter, age, gender, and cultural background, are rarely the most relevant.
The characteristics are put on the axes in a graph. The users that you would like to focus on are the so-called boundary users and someone average (in the middle). Note that the boundary users are not the extreme users, but someone in that exist in the outskirts of the target group but still within. The extreme users are often atypical and hard to please, so these are not the ones we are looking for. Be wary of these when finding users through customer support.
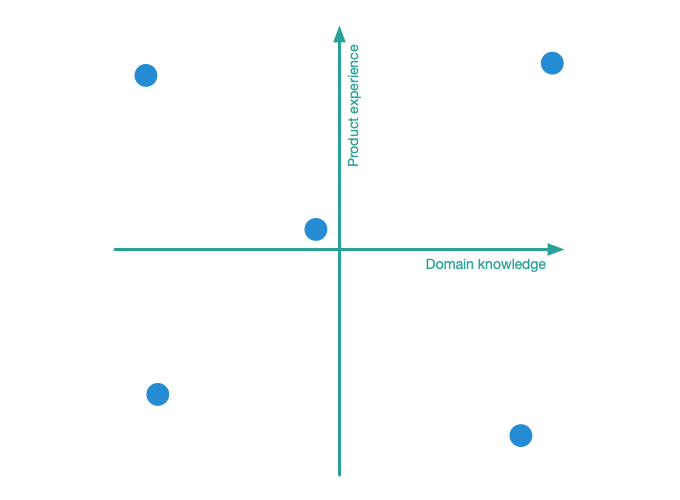
For a 2-axis cube (also known as graph), that will sum up to five users. These could be the five users you start talking to, to find out the boundaries of your target group and what characterizes the people inside. If you feel that the five users you’ve picked tend to be very knowledgable of something, this might tell you that they are in the top of another characteristics axis, and might be a reason to expand or redefine the boundaries.
In a project done for Travellink, an online business travel agent, the knowledge within the software development group about their intended target group was quickly expanded after we found that there were a lot users who were both less experienced and bought less trips than the people they usually were in contact with. The finding was visualized in what I call a user spread.
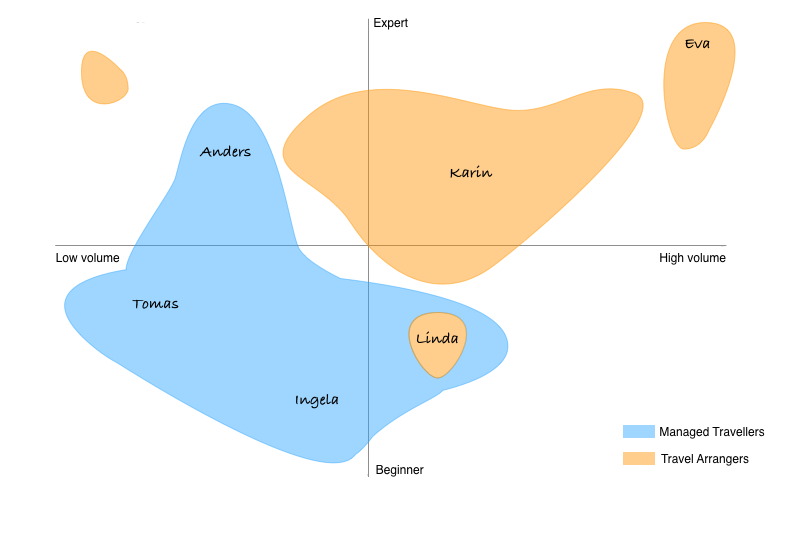
The areas would later represent personas and in the image above you can see them named Karin, Eva, Linda, etc. The first user cube done covered only the Eva and Karin area. As you can see, the user spread above also visualizes a third dimension, behavior, in showing both travel arrangers and travelers who book for themselves.
Are there more benefits of this technique?
Apart from getting a starting point with your user-centered design, you can build personas of these and you can plan your user tests according to Jakob Nielsen’s familiar quote.
Personas
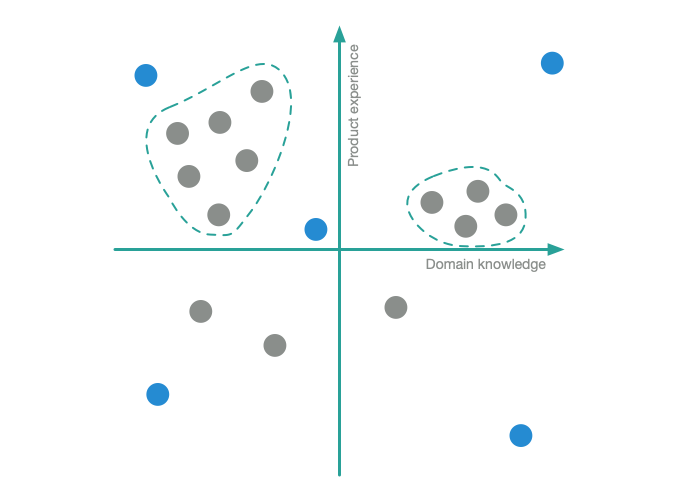
When talking to your target group, you can plot them in your cube or graph as you meet them. This will show you how the users you’ve spoken to relate to each other in terms of the characteristics you’ve chosen. When you think you’ve spoken to a sufficient amount of users, you can use the median of the cube or graph to build a persona. This is usually more accurate than taking the average values of the whole group. If you have different clusters of similar users, as in the user spread for Travellink shown above, you will get several personas.
Jakob Nielsen – “Five users are enough”
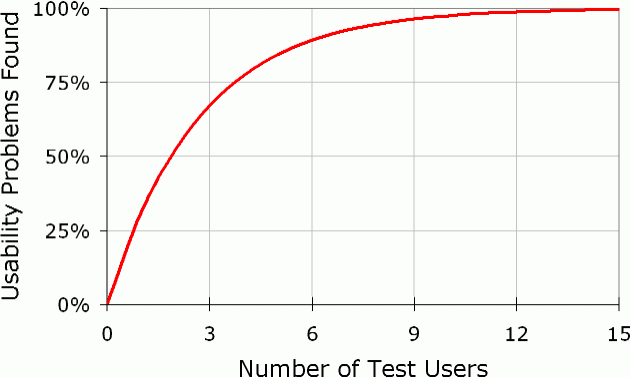
As Jakob Nielsen and Tom Landauer found in 2000 (and that has been revisited many times after that), you only need to run usability tests with five users (from within the target group of course) to find the most important usability problems of a product. With the user cube/graph you do have these five users, they are preferably the 4 boundary users and the average one.
Testing in stages
The graph in the Jakob Nielsen article mentioned above shows that 15 usability tests would cover finding basically all the usability problems of a product.
This also applies to finding problems in a prototype. When building something new and you are doing continuous formative evaluation, you can test with 5 people in the first round. Then in the second and third round (such as when you have gone from a low-fidelity prototype to something more advanced), keeping a few of the users from the first round on, ensures that you also cover people who have learned a little bit of the interface. My suggestion looks like this:
| FIRST ROUND (LO-FI) | SECOND ROUND (HI-FI) | THIRD ROUND (LIVE) |
|---|---|---|
| 5 new | 3 new | 2 new |
| 2 first-rounders | 1 first-rounder | |
| 2 second-rounders |
Naturally, you should try to substitute users from the first round with users from the same area in the user cube/graph, to cover the same kind of needs and behaviors.
Now it’s time to meet the users.


Leave a Reply
Want to join the discussion?Feel free to contribute!